Right now I am only logging request + response data. I must change the code to log the full response packet.
In my logs I do not see that I have sent any empty response with only a Unicode char (which would be invalid JSON) – all the responses in my log have the correct form:
{ "items": [...], "pagination": {...} )
So, seems like we stuck in troubleshooting. I’ve added more logs, could you try again please?
@Evgeni_Kisel - OK, now I am also logging request & response headers.
Still I see this sync error: Response from connector was not in the correct format (JSON). Response: �
And still I can find no Unicode chars in my logged data (including headers now).
What can I share with you to help on your end? I have these logs from the last sync:
2023-06-16T21.44.26.093Z validate - 200 -: "x-correlationid":"141faa3a-f7b4-45d5-b3a0-abdf04026314"
2023-06-16T21.44.26.262Z config - 200 -: "x-correlationid":"141faa3a-f7b4-45d5-b3a0-abdf04026314"
2023-06-16T21.44.26.724Z config - 200 -: "x-correlationid":"95d40749-8bde-4aa4-b1ab-ae1b3ced9c04"
2023-06-16T21.45.21.838Z config - 200 -: "x-correlationid":"e860c6a9-0511-4054-8422-214940794959"
2023-06-16T21.45.21.845Z config - 200 -: "x-correlationid":"da151912-656c-4daa-9d29-24cb7e70e4d1"
2023-06-16T21.45.42.099Z validate - 200 -: "x-correlationid":"edb9325b-b444-407f-80ff-3ccc59f05b27"
2023-06-16T21.45.42.246Z config - 200 -: "x-correlationid":"edb9325b-b444-407f-80ff-3ccc59f05b27"
2023-06-16T21.45.42.332Z config - 200 -: "x-correlationid":"0e31d6f8-b814-4ebb-8f02-3dc569d717f0"
2023-06-16T21.45.51.229Z config - 200 -: "x-correlationid":"d399baa6-89af-4ef3-b74f-ba4008c14426"
2023-06-16T21.45.51.778Z validate - 200 -: "x-correlationid":"d399baa6-89af-4ef3-b74f-ba4008c14426"
2023-06-16T21.45.51.919Z config - 200 -: "x-correlationid":"d399baa6-89af-4ef3-b74f-ba4008c14426"
2023-06-16T21.45.52.207Z schema - 200 -: "x-correlationid":"d399baa6-89af-4ef3-b74f-ba4008c14426"
2023-06-16T21.45.52.786Z data Zoho_Instances 200 -: "x-correlationid":"d399baa6-89af-4ef3-b74f-ba4008c14426"
2023-06-16T21.45.59.073Z data Contacts 200 +: "x-correlationid":"d399baa6-89af-4ef3-b74f-ba4008c14426"
2023-06-16T21.46.06.674Z data Contacts 200 +: "x-correlationid":"d399baa6-89af-4ef3-b74f-ba4008c14426"
2023-06-16T21.46.13.068Z data Contacts 200 +: "x-correlationid":"d399baa6-89af-4ef3-b74f-ba4008c14426"
2023-06-16T21.46.19.678Z data Contacts 200 +: "x-correlationid":"d399baa6-89af-4ef3-b74f-ba4008c14426"
That symbol is a part of Description field. But I still don’t understand why it can’t parse it. So at the end I’ve given up and added sanitizing code. Could you try once again please?
I have started another sync. Can you share the entire record that goes with that Description field?
Won’t share all entity.
entity id is: 4948722000003708098 (if I found correctly)
description:
\"**here goes a lot names so I've removed them** not responding\\nSupply Chain Manager ���"
This appears to be the data I logged as sent, which corresponds to that string in Description (but it continues further, as you can see):
Now I am seeing a different error:
please try again, it may happen due to tech some factors (tech debt).
you are throttled by your 3rd party system.
your connector respond with html response with status code 500. In this case you should either send one of retryable error code or send error response in JSON format with tryLater: true
I am working on updating the logging and error handling for the connector.
Meanwhile:
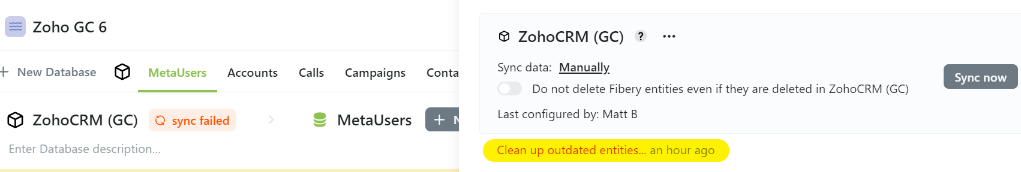
Clean up outdated entities is a sync step.
synchronization completed with type specific errors for 64891ce5d888b209b93fd7cb and host jrp-zoho.fibery.io with errors
<html><head>
<meta http-equiv="content-type" content="text/html;charset=utf-8">
<title>500 Server Error</title>
</head>
<body text=#000000 bgcolor=#ffffff>
<h1>Error: Server Error</h1>
<h2>The server encountered an error and could not complete your request.<p>Please try again in 30 seconds.</h2>
<h2></h2>
</body></html>
Dated Jun 21, 2023 @ 01:19:54.770(GMT+3)
@Evgeni_Kisel, I do not believe these HTML error messages are coming from my connector app.
- I see nothing in my app’s logs that correlates with this
- I received no errors from Zoho
- My app does not have any code to generate HTML error messages.

Is it possible that Google App Engine itself could generate this somehow, yet leave no trace in the logs? It seems unlikely.
Is it possible that some other part of Fibery’s infrastructure is generating these errors?
Yes, it’s possible. Depends on your architecture. Let’s imagine that your app under google proxy then all requests are received by your proxy and then (if everything is ok) are proceed by your app.
So, I’ve added simple stupid instruction to run retry in that case (retry if message contains “try again”). Could you try again please?
How is pagination info handled after I return an error with tryLater: true ?
Should I include pagination info in the error? (how?) I will need it to resume subsequent data fetching.
Or will Fibery remember the pagination info I sent with the last successful data response and pass that back to me in subsequent requests?
Fibery smart enough to remember pagination, so no worries pagination will be preserved
@Evgeni_Kisel This happens after a long period of “Cleaning up outdated entities” –