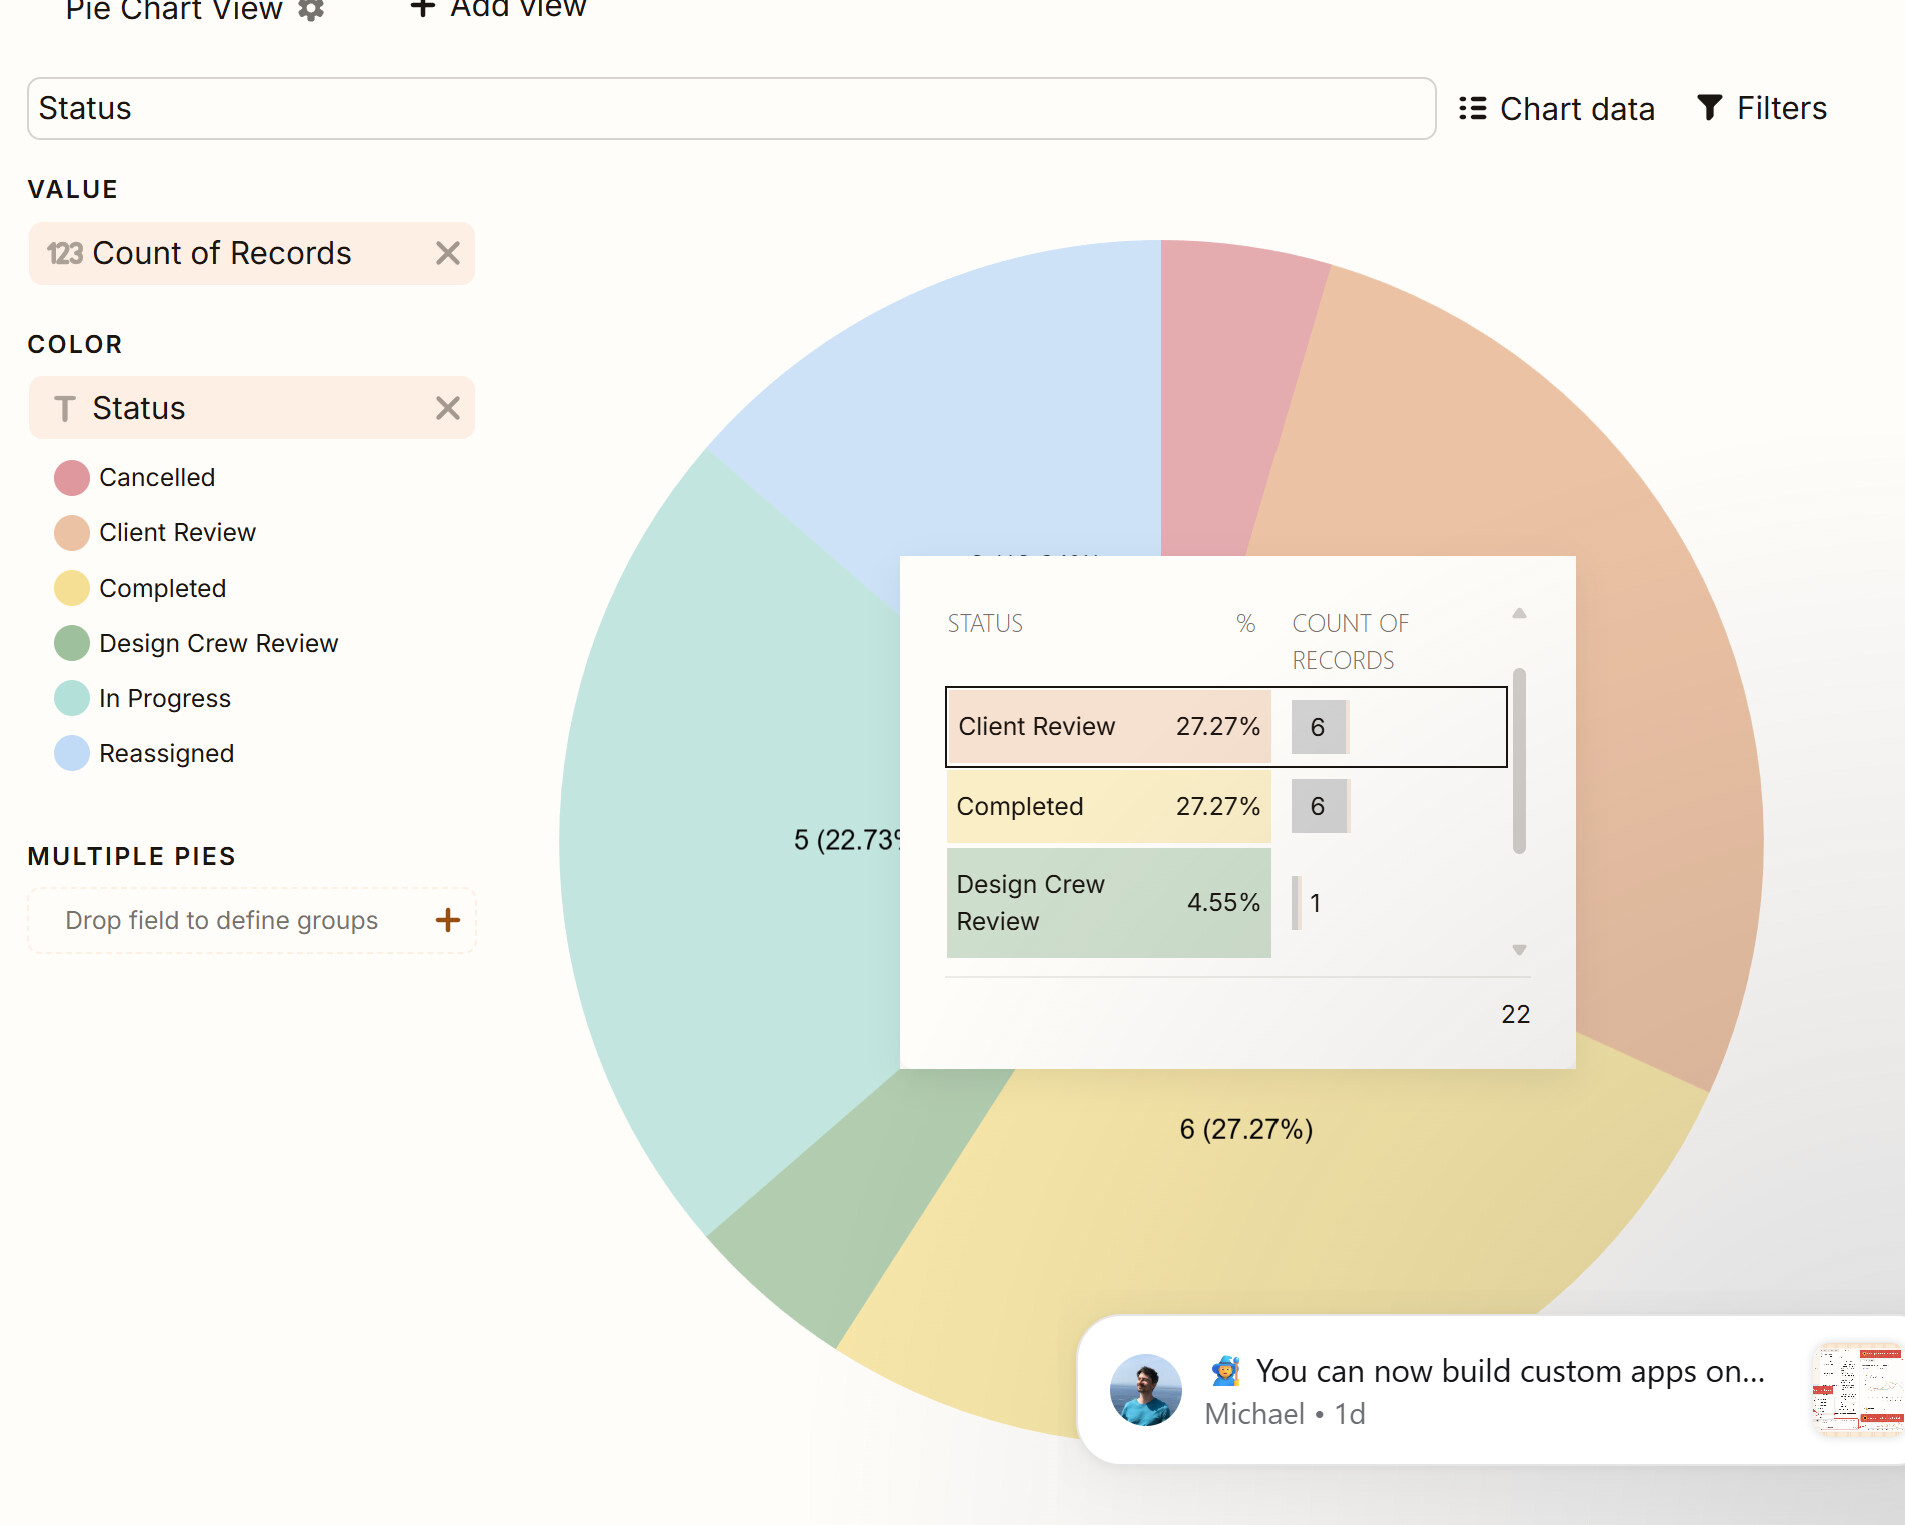
Hi all, I’m looking to count the number of items that are a specific status and make them into a pie chart. I’m struggling a bit, since I have to create a formula for it but I can’t seem to get the hang of it.
What I did, was create a column for status. In it, I can mark an item as completed, in progress, etc. I would just like to count the number of complete items, in progress, etc, and place them all in a pie chart. Could anyone help me figure this out?
Thank you so much! The step by step was really helpful, but I got lost at number 7.
When you said, “enter your status field name again”, where do I go to add the color/split type? In Value, or Color? So far I’ve done the screenshot in my Value field: