Introduction
A new “Dashboard Card Stream field layout mode” upgrades classic collection fields by swapping tabbed views for a scrollable stream of widgetized cards. This is delivers dynamic insights for project managers etc.
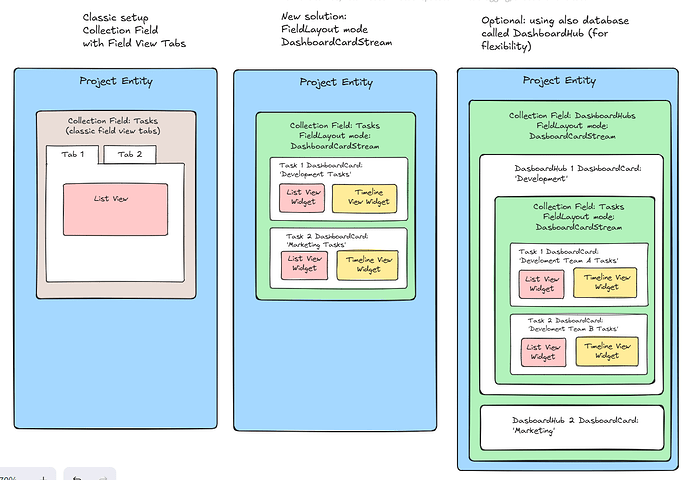
Below you see three setups:
- Classic setup: how a collection field currently is.
- Collection field displayed with field layout mode ‘Dashboard Card Stream’. This is the key new feature.
- Optional, but recommeded is to combine that new feature with a parent database to display Dasboard Cards of different departments, teams, etc. This is useful for complete overview and insight (e.g. project managers)
Limitations of Classic Collection Fields and Dashboard Integration Need
Classic collection fields (e.g., “Tasks” in a Project) rely on tabbed views (List in Tab 1, Board in Tab 2), requiring switching and lacking unified overviews. Filters are contextual or global, but no dynamic widgets.
The new Dashboard feature (experimental July 10, 2025) enables widget canvases for views/reports, but it’s sidebar-bound and not entity-integrated—needing embedding in entities for better workflows like project management.
Why New Collection Field Layout Mode
“Dashboard Card Stream” mode replaces tabs with a scrollable card stream, each showing a widget canvas (e.g., List/Timeline View Widget), auto-filtered by parent (e.g., Project). Lazy-loaded for performance, it provides at-a-glance insights within the entity detail page.
Optional Setup B for Flexibility
Use any database as “parent entities” (no new development) to organize cards/widgets meaningfully. E.g., “DashboardHub” DB with entities like “Development”/“Marketing,” each with “Tasks” in Dashboard Card Stream mode, chaining filters (Tasks > DashboardHub > Project).
Purpose and Motivation
Both deliver direct overviews for project managers, reducing navigation for quick decisions. Development motivation: Enables holistic insights in complex projects.
Use Case: Product Launch Project
- Without Extra Database: Project’s “Tasks” in Dashboard Card Stream streams Task cards with widgets (List for backlog, Timeline for deadlines), filtered to Project. Manager scrolls for aggregated task oversight—ideal for simple projects spotting delays.
- With Parent Database (DashboardHub): “DashboardHub” DB with “Development” (Kanban for code tasks, Timeline for sprints) and “Marketing” (Table for campaigns, Pie Chart for budget). Project’s “DashboardHubs” in Dashboard Card Stream streams these as cards, nesting Tasks in the same mode. Manager scrolls for team-specific breakdowns—perfect for complex projects with segmented views.
