I’m trying to create a bar chart that shows sprints on x axis and a stacked bar of stories, bugs, tasks with DONE state on y axis. These types can be added to multiple sprints though.
Is there a formula I could use to only show items in the last sprint they are associated with, rather than being included in every sprint column they are in?
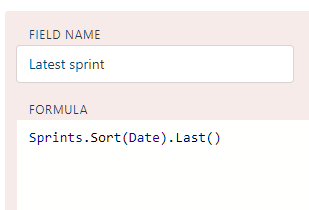
I suspect you would benefit from creating a formula field (in all of the story, bug and task databases) which extracts the latest linked sprint.
Something like this:
You can then use this field as your x-axis in a report, and use a filter (State=Done) to only show the relevant stories/bugs/tasks.