I’m trying to create a fairly simple burndown-style historical Report - a line chart of number of “open” Bugs over time. This seems simple enough, but I’ve not been able to make it work.
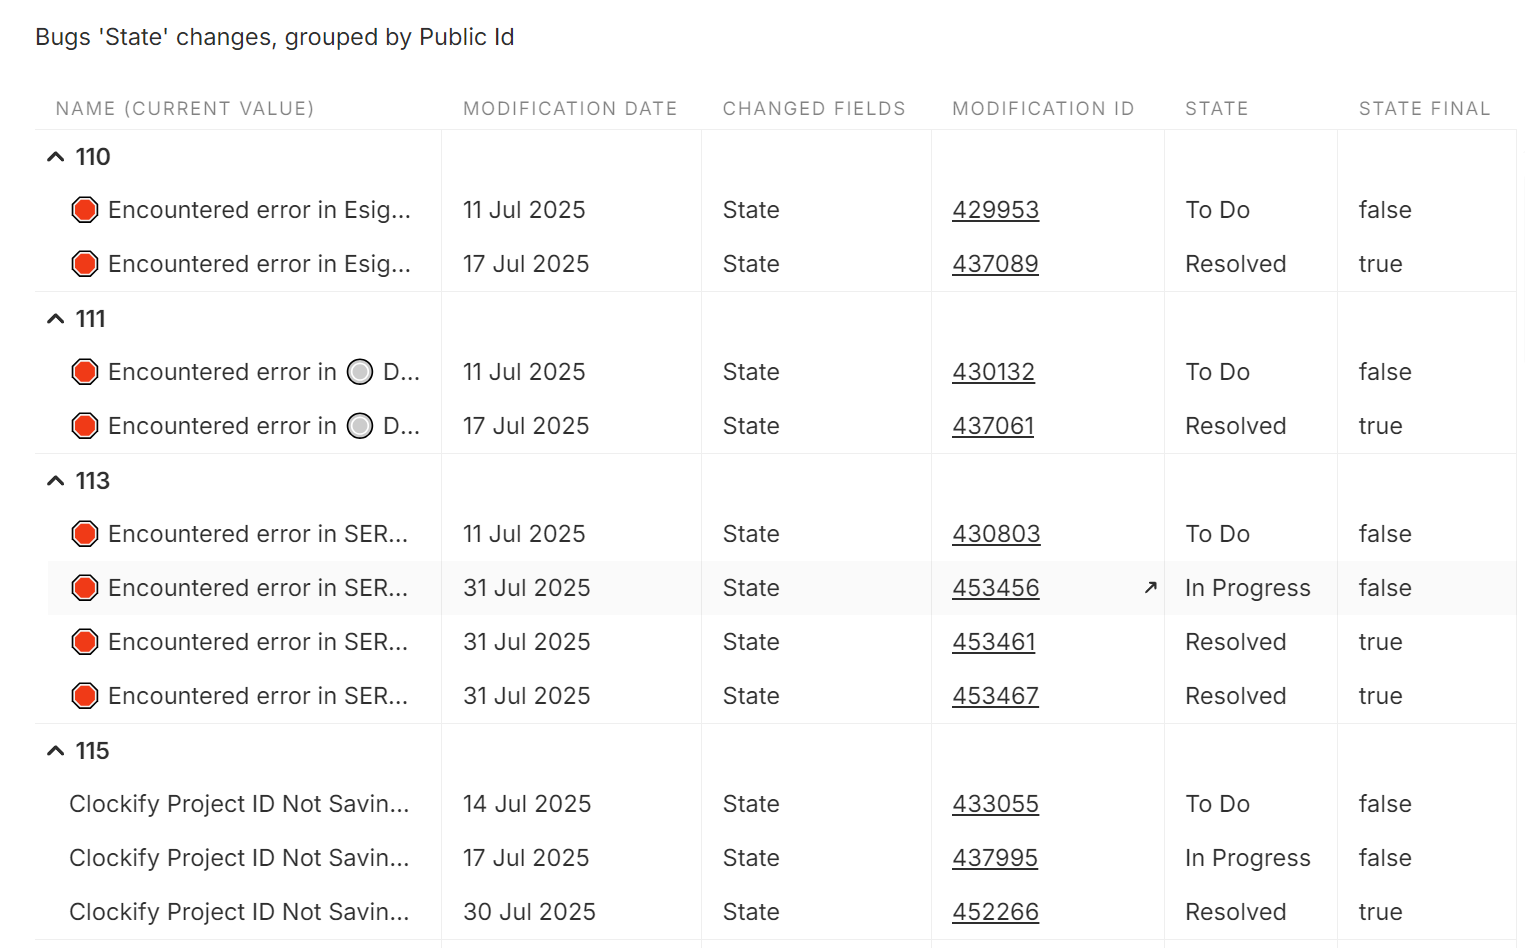
I’m filter the Historical Change records of Bugs for only the ones where the “State” changes:
I need to track/count the number of open Bugs (where [State final]==False).
I assume this would be the RUNNING_COUNT of created bugs minus the RUNNNING_COUNT of closed bugs. But I can’t find a function that will do this - it would need to be something like RUNNING_COUNTIF which does not exist.
Another issue: looking at the table above, you can see that Bug #113 transitions to “Resolved” twice, which begs the question of how to count bugs transitioning to [State Final]==True, without double-counting?
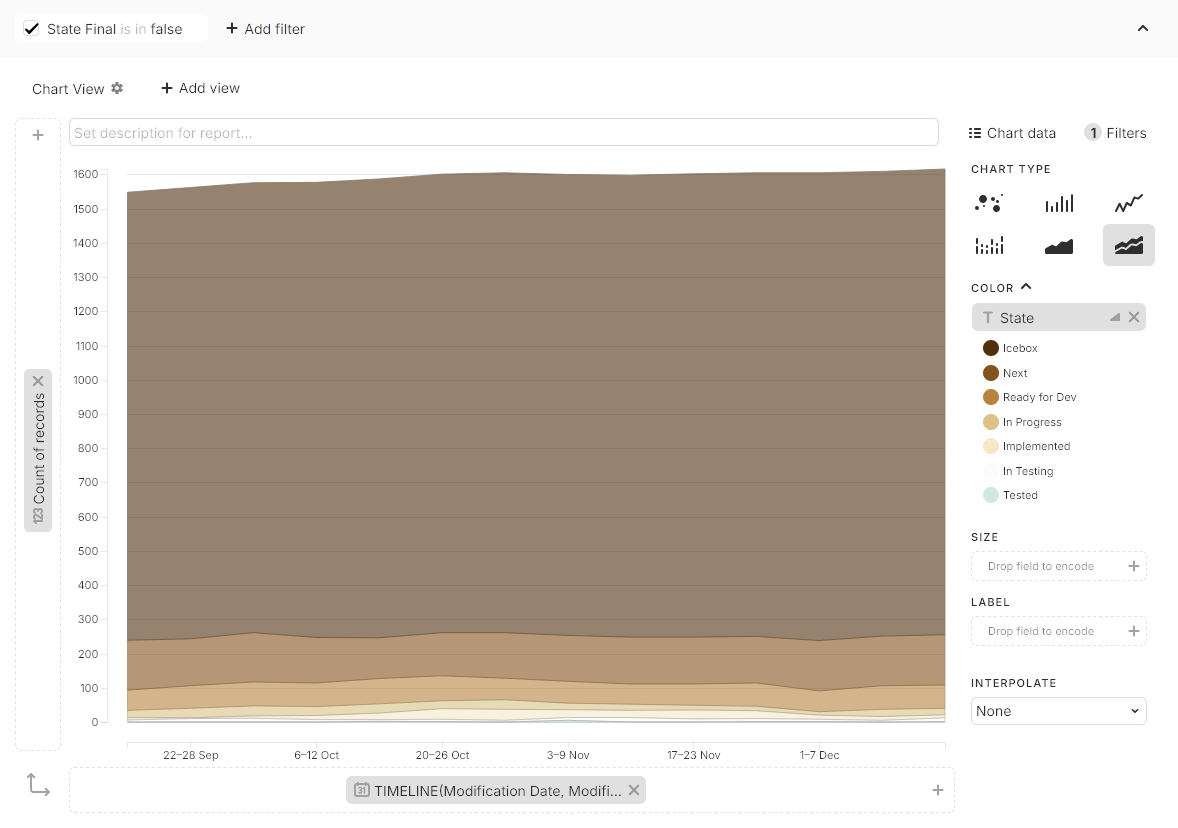
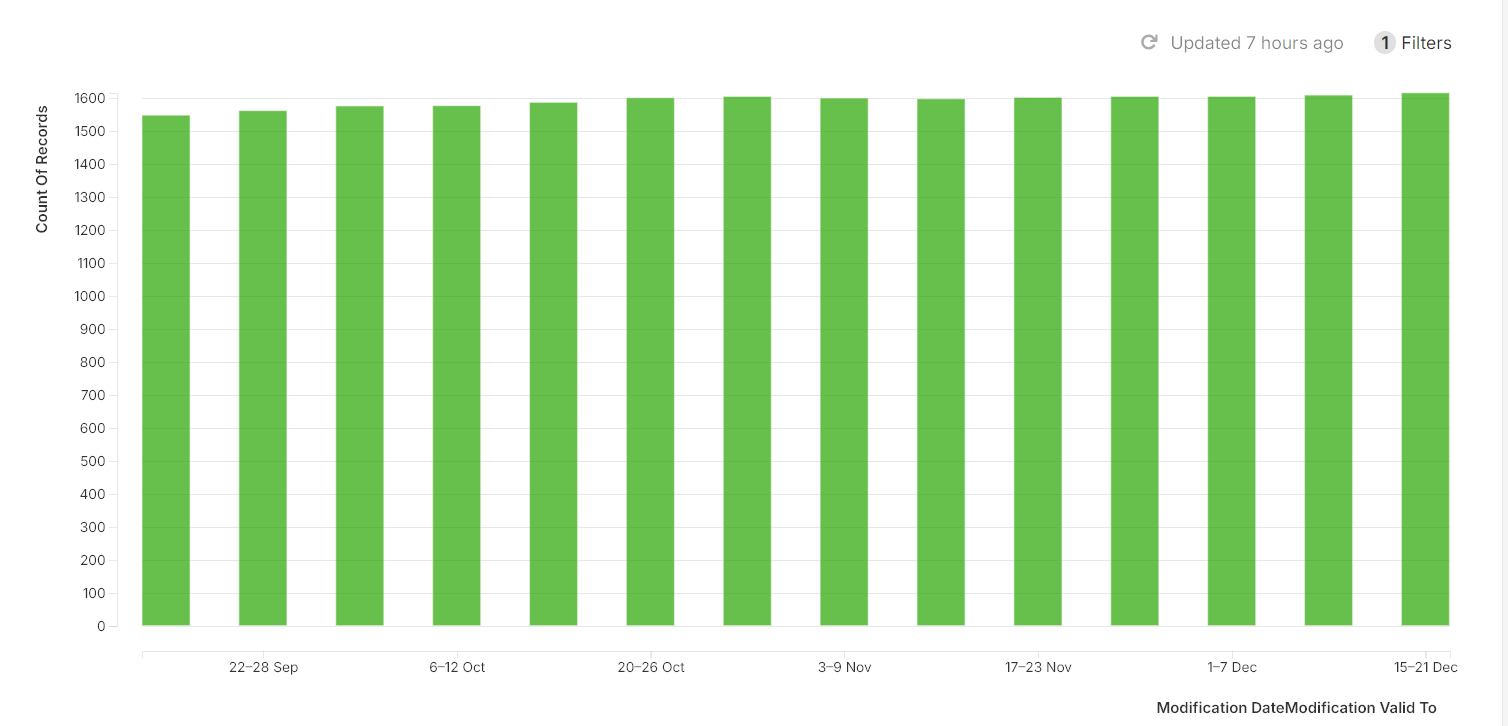
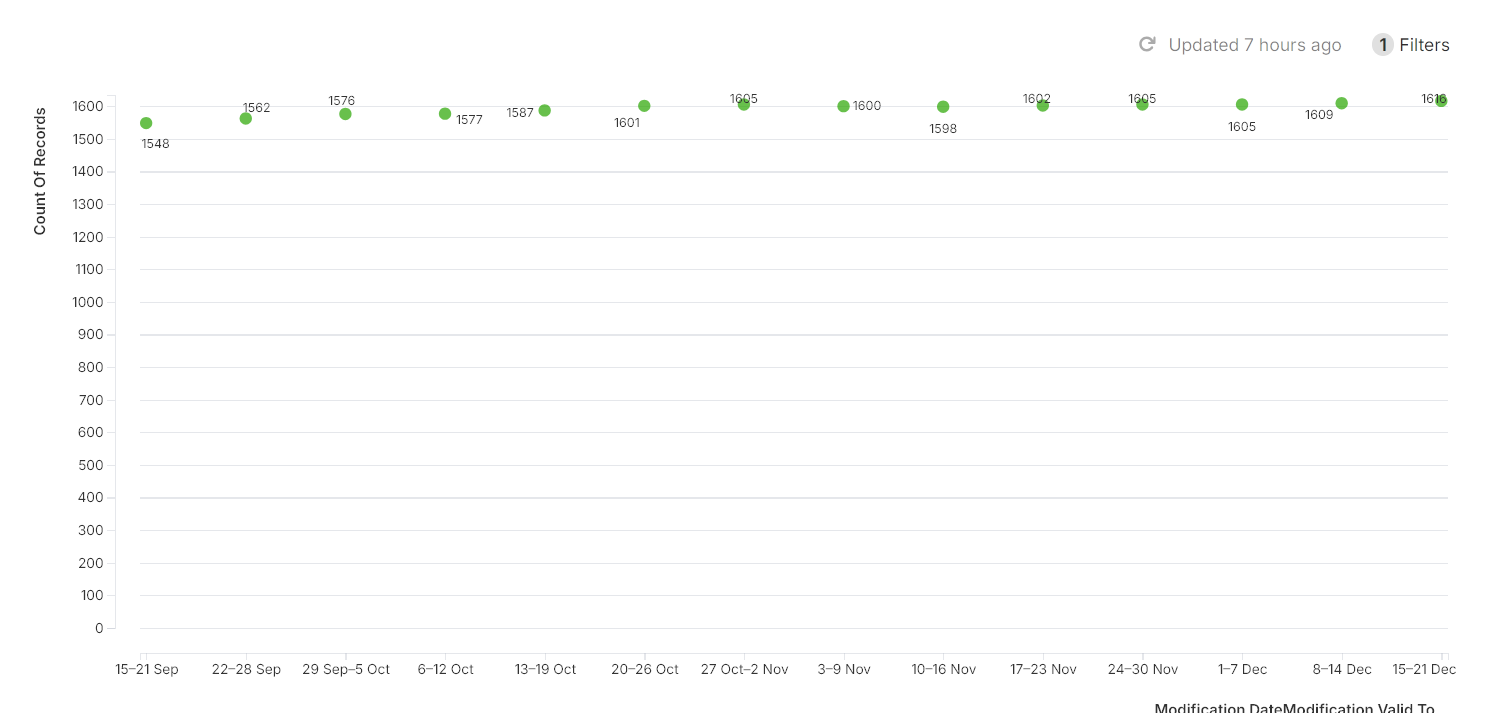
Assuming that you want a chart (with time on the x-axis) and count of records in each state on the y axis, then I would suggest using the TIMELINE() function, e.g.
Well, I’m not sure what you are after, since as far as I can tell, the example I gave is showing exactly how many entities are in the non-final state over time.
I mean, you could turn off the color coding by state and show a line instead of a stacked area chart.