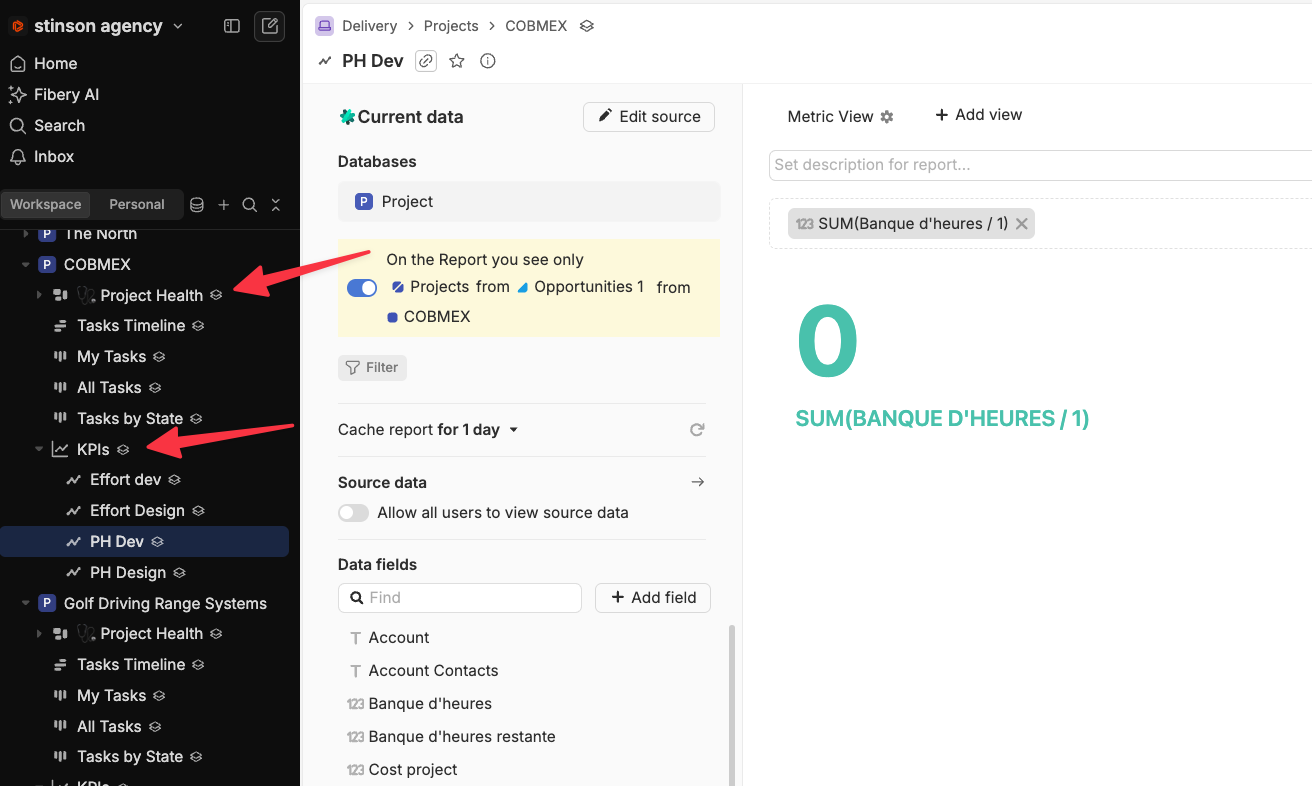
I’m trying to build a simple dashboard by using the Metric KPI widget. But it seems that it cannot report non-aggregated number… like .. I want the planned hours and project budget that are just a number field … how can i achieve that?
It’s really annoying that sometimes simple things are the hardest -_-
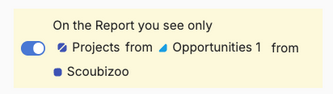
You are using a ‘context report’ which means the source data is all the Projects which are from Opportunities 1 from Scoubizoo.
This means that the source data will be a collection of Projects, even if there might only be a single linked Project in some cases.
The report cannot know how many Projects might be linked, and has to work with aggregated numbers.
Thank you, now I understand better. So what would be the best way to have a dashboard with multiple data mixed with aggregated and non-aggregated kpis?
When creating calculations in a report, even though you are using aggregation, you can use filters to limit the entities to be aggregated.
e.g. if necessary, you can limit to a single record, for example SUMIF([Effort],[Public Id]=='1')
Yeah that won’t work. The dashboard is inside the Smart Folder … Im trying to build a dashboard for the “Project Health” view for every project. I have the real effort from the team and Projected Hours (PH)
The SUM of the effort done by the team is working. The tasks are linked to the project and it works fantastic. But my simple number field inside the Project, is not working.
I don’t understand. I know it’s a context view so it SHOULD work since I only have one field for the Projected Hours
In general, context views in smart folders are not used to view data/values from the entity which is the folder itself.
I imagine your report is including data from multiple (or no) project entities, which may or may not include the project whose folder the report lives in.
Here’s a suggestion: create a table visualisation in the report (in addition to the KPI visualisation) and add Name, Banque d’heures as columns. It will probably clue you in to what’s happening.